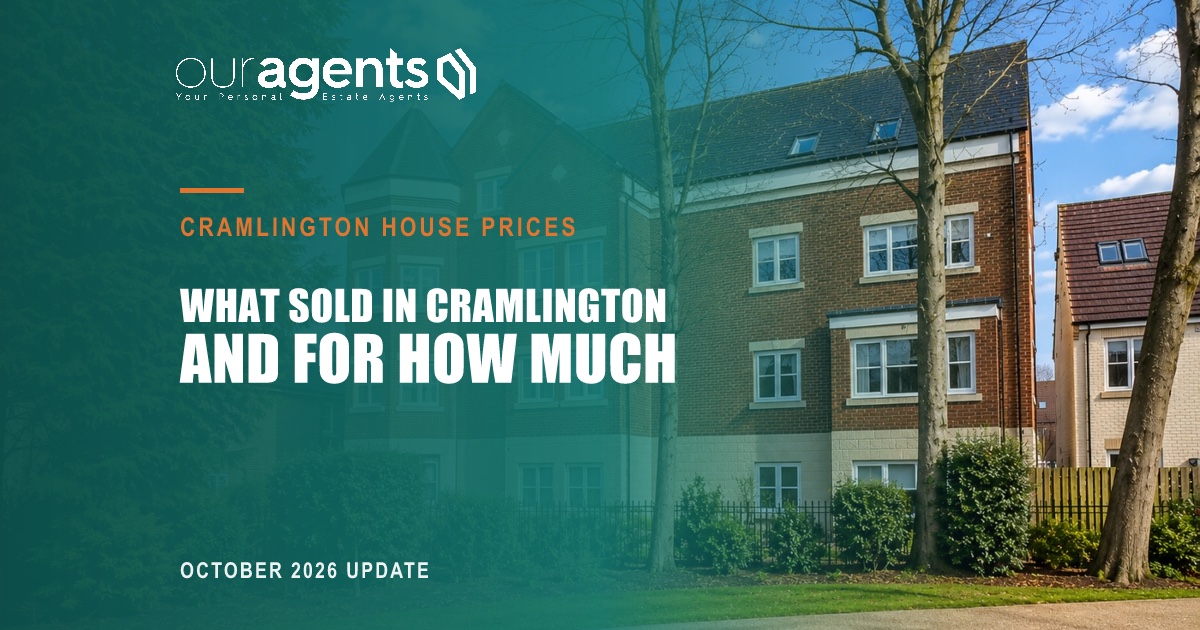
The average sold price in Cramlington over the latest 12 months of Land Registry data is £213,115, from 477 registered sales. That figure is down 5.1%, or about £11,383, on the previous 12 months (£224,498). Here is what sold, for how much, and what it means whether you are selling or buying in Cramlington, Northumberland.
Cramlington house prices: the 12-month picture
Cramlington house prices have eased on the headline measure. The average across all 477 registered sales is £213,115, against £224,498 for the 12 months before. These are real completed sales recorded by HM Land Registry, not asking prices, which makes them a firmer guide than the figures on property portals.
Two cautions when reading any average. First, it blends very different homes: a handful of large detached houses can lift it, and a run of smaller terraced sales can pull it down, so a change in the average does not always mean an individual home gained or lost that amount. Second, Land Registry data is registered with a delay, so the most recent months can still be filling in and figures can be revised as more completions come through.
Property services in Cramlington
- Estate agents in Cramlington
- Sell my house in Cramlington
- Free property valuation in Cramlington
- Conveyancing solicitors in Cramlington
- Mortgage advisers in Cramlington
- Property surveys in Cramlington
Find out what your home is really worth
Book a Selling Advice Meeting and Valuation with Our Agents. An honest figure for your home, a clear plan to sell it, and our complete selling package at £1,299.
Book a valuationAverage price by property type in Cramlington
Property type explains far more of the price than the headline number does. This is what each type averaged over the same 12 months.
| Property type | Average price | Number of sales |
|---|---|---|
| Detached | £329,356 | 110 |
| Semi-detached | £178,829 | 154 |
| Terraced | £153,942 | 161 |
| Flat or maisonette | £84,189 | 37 |
Terraced homes were the most common sale, with 161 registered. A detached home in Cramlington averaged £175,414 more than a terraced one (£329,356 against £153,942), and a flat averaged £84,189 across 37 sales. A small number of sales fall outside these four types, so the rows do not add up to the full total of 477.
The latest month: July 2026
For July 2026, Land Registry records 29 sales in Cramlington at an average of £211,577, which is below the 12-month average. A single month is a small sample and moves around with the mix of homes that happen to complete, so treat it as a snapshot rather than a trend. The most expensive sale that month was £495,000.
What this means if you are selling in Cramlington
The headline average is not the price of your home. What matters is what homes like yours, in your street and condition, have actually sold for. If you own a terraced house, the relevant benchmark is the £153,942 terraced average, not £213,115; if it is detached, look at £329,356. Even within a type, size, condition, garden, parking and location can shift the figure by tens of thousands of pounds.
Price it against genuine comparable sales, present it well, and be realistic about where the market is now. Homes that start at the right price attract viewings in the first weeks, when interest is highest, and avoid the slow drift of repeated reductions. If you would like an honest figure for your own home, you can book a free house valuation in Cramlington, or read how we sell homes in Cramlington with our complete selling package at £1,299.
What this means if you are buying in Cramlington
For buyers, sold prices show what homes of the type you want really cost, so you can judge whether an asking price is in line with recent sales. Flat / Maisonette sales averaging £84,189 and terraced homes at £153,942 are the usual way in for first-time buyers, while £178,829 is the semi-detached benchmark for growing families. Check how many comparable sales there have been: with only 37 flat sales over the year, for example, a single sale can move that average noticeably.
Compare the asking price with the recent sold prices for the same type, arrange your mortgage in principle before you view, and be ready to move quickly on a well-priced home. The full breakdown, updated from the same Land Registry source, is in our Cramlington house prices report, and you can see how local agents compare on our page for estate agents in Cramlington.
How we have calculated these figures
The figures come from HM Land Registry price paid data, covering sales registered in Cramlington over the latest 12 months and the 12 months before. Prices are actual sold prices. Averages are simple means, so they are affected by the mix of homes sold. Where a figure is not available we have left it out rather than estimate it.
Source: HM Land Registry price paid data via Our Agents' market reports, latest 12 months of registered sales, with the latest monthly figure for July 2026.